https://theconversation.com/earthrise-to-earthset-how-the-planets-climate-has-changed-since-the-photo-that-inspired-the-environmental-movement-279818
For me as a climate scientist, these photos, taken 58 years apart, inspire me to reflect on how the Earth’s climate has changed in the interim.
The concentration of carbon dioxide (and other greenhouse gases) in our atmosphere has rapidly increased as a result of over half a century of continued and spreading industrial development, driven primarily by burning fossil fuels.
This is clearly illustrated by the Keeling curve – a graph that plots the continuous record of atmospheric CO₂ from Mauna Loa Observatory in Hawaii (started by Charles Keeling in 1958).
Read more: Mauna Loa Observatory captured the reality of climate change. The US plans to shut it down
This curve shows a steep and steady increase from approximately 320 parts per million (ppm) in 1968 to about 430ppm in 2026. This increase of over one-third in the total carbon dioxide in our atmosphere shows little sign of slowing down.
For me as a climate scientist, these photos, taken 58 years apart, inspire me to reflect on how the Earth’s climate has changed in the interim.
The concentration of carbon dioxide (and other greenhouse gases) in our atmosphere has rapidly increased as a result of over half a century of continued and spreading industrial development, driven primarily by burning fossil fuels.
This curve shows a steep and steady increase from approximately 320 parts per million (ppm) in 1968 to about 430ppm in 2026. This increase of over one-third in the total carbon dioxide in our atmosphere shows little sign of slowing down.
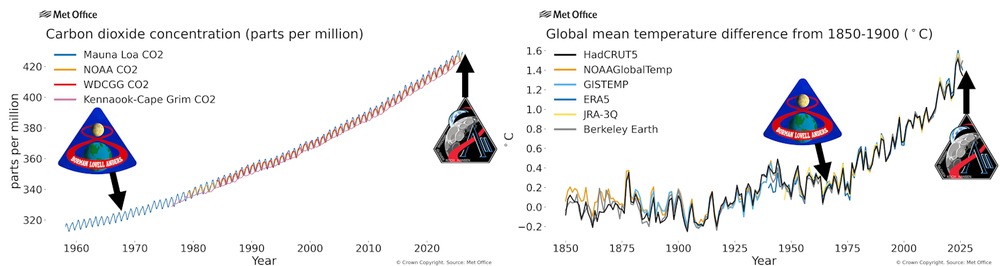
That additional blanket of greenhouse gases has increased the surface temperature of our planet. Data from the World Meteorological Organization shows how the global mean temperature record (the average temperature of the Earth’s surface) has risen by approximately 1.2°C since the Apollo 8 Earthrise photo was taken. This represents most of the warming that has happened since the early industrial period in the mid-19th century.
While an average global temperature increase of 1.2°C may not sound large, it means that regional hot extremes and new records are now much more likely. For example, my team’s recent research has shown that a 40°C day in the UK (first recorded on July 19 2022) is now over 20 times more likely than it was in the 1960s.
The global average temperature has surged in the past three years – most probably driven by a combination of internal climate variability and human-made emissions (including strong reductions in industrial aerosol particle emissions that largely act to cool the planet). In 2023, temperatures jumped from the previous record of 1.29°C (set in 2016) to 1.45°C above the early-industrial 1850-1900 baseline…